Category Archives: Tools

Adding Log4Net to your MVC project

Log4Net supports writing to multiple sources through the use of “Appenders”. For this post, we will take a look at the AdoNetAppender which allows us to easily write logs to a database table. To begin lets create a new MVC project.

Next we add a reference to Log4Net using the NuGet package manager.

To continue, add a new XML file to your solution, name it Log4Net.config and then copy the following code into the new file. http://pastie.org/6118426 The AdoNetAppender can get tricky because it has a few options that usually go undiscussed. The first tricky part to note here is the “bufferSize” attribute which when set to 0 indicates not to use buffering. Once we complete the Log4Net configuration we will see that logging data to the table is very easy and that it will not be extraordinary to log more than 10 messages for each page request depending on the amount of work a page processes.  To mitigate the impact increased database traffic would have on performance the AdoNetAppender allows us to batch these inserts into the log table. However, I recommend leaving this setting at 0 until you notice a performance impact. I consider this the first hiccup for installing Log4Net as some examples I have seen set this value to 10 and then skip discussing this piece. This usually makes it look like logging is not working when we run a simple logging test with one example message because only after we have 10 messages will the entire buffer be flushed and written to the database. Another core feature of Log4Net is the ability to configure your log level. Log4Net captures information in prioritized categories.

  • Fatal
  • Error
  • Warn
  • Info
  • Debug

In our example we have configured the Appender to capture information at the INFO level. Unless we change this setting our messages created under the DEBUG category will not get saved to the database. However, we will still see the more severe categories of FATAL, ERROR, and WARN in addition to INFO. By using this priority of severity I find most projects do not need the buffering option and are instead deployed with a WARN or ERROR level setting while the DEBUG and INFO settings are reserved for developer workstations and QA servers not being load tested. Another hiccup I usually see is found in the insert statement itself. Make sure your insert command matches the log table you created. For our example we will use the following SQL to create a log table.

CREATE TABLE [dbo].[Log4Net] (
[ID] [int] IDENTITY (1, 1) NOT NULL , [Date] [datetime] NOT NULL , [Thread] [varchar] (255) NOT NULL , [Level] [varchar] (10) NOT NULL , [Logger] [varchar] (1000) NOT NULL , [Message] [varchar] (4000) NOT NULL , [Exception] [varchar] (4000) NOT NULL
) ON [PRIMARY]

The last piece to discuss is the connection string which I intentionally left as “{auto}” in our example. By default this configuration file is not loaded by the application and as such our logging is not yet enabled. Also, in most scenarios, we want to use the same database connection string throughout the application. To accomplish both of these goals I created the following helper classhttp://pastie.org/6118219 After copying this class into your project simply call the public method “InitializeLog4Net” during the “Application_Start” event of your Global.asax.cs class. The Log4NetManager class will load our Log4Net.config file and the Appender configuration it contains. Next it will find the AdoNetAppender settings we just loaded and override the connection string (if it is set to “{auto}”) with the connection string specified for our entity model which takes care of keeping our two connection strings synchronized! At this point, Log4Net is configured and ready to run. All we have to do now is create some log entries.

To create our log entries we need an instance of a logger. The typical usage scenario is to get a logger that represents the class you are working in, as we do here using the typeof operator. After that we can create error messages by category. In this example “logger.Debug” will be ignored by the logger because we set the log level to INFO. In the second example we insert our test message “HELLO WORLD” and then finally we catch and report an exception message that occurred from an InvalidOperationException. Now, each time the Home/Index action runs it will insert two new records into the Log4Net table in the Northwind database as configured by the our entity connection string. via: http://www.oakwoodinsights.com/adding-log4net-mvc-site/

Introducing node.js Tools for Visual Studio

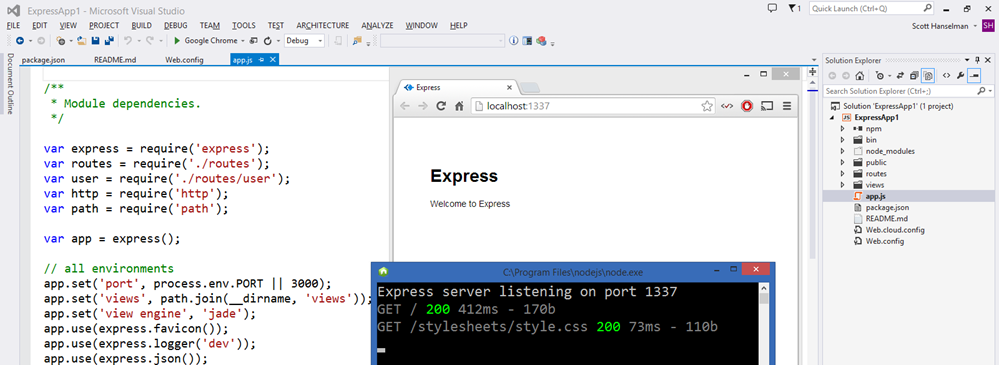
node.js and Express running in VS

Just when you thought it couldn’t be crazier in Redmond, today they are introducing node.js Tools for Visual Studio!

NTVS runs inside VS2012 or VS2013. Some node.js enthusiasts had forked PTVS and begun some spikes of node tools for VS. At the same time the PTVS team was also working on node.js integration, so they all joined forces and made NTVS a community project. NTVS was developed by the same team that brought you PTVSwith help from friends like Bart Read from Red Gate (he did the npm GUI), and Dmitry Tretyakov from Clickberry for several debugger fixes & features.

NTVS is open source from the start, and has taken contributions from the very start. It supports Editing, Intellisense, Profiling, npm, Debugging both locally and remotely (while running the server on Windows/MacOS/Linux), as well publishing to Azure Web Sites and Cloud Service.

It’s actually pretty freaking amazing how they did it, so I encourage you to download it and give it a try because some of the stuff (even given this is an alpha) is very very clever.

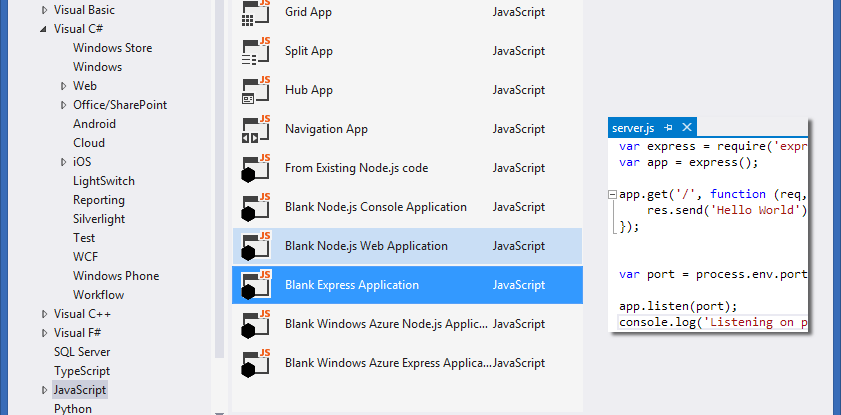
Blank Express Application

Node.js Tools for Visual Studio takes advantage of V8 Profiling API’s as well Visual Studio’s Reporting features to give you a sense of where your program is spending its time.

NOTE: See that File | New Project dialog up there? Visual Studio organizes things by language, so node.js is under JavaScript. But you’ve also got Python and Django, iOS and Android via C#, TypeScript, VB, F#, all in Visual Studio.

One of the things that’s impressed me about the way they integrated node.js into Visual Studio was that they didn’t try to recreate or re-do things that already worked well. It’s node, it runs node.exe, it uses the V8 debugger, it uses the V8 profiler because that’s what people use. Duh. But, for example, NTVS can take the output from the V8 profiler and display it using the Visual Studio Profiler Reporting Tools. No need to reinvent the wheel, just use the right tool for the job.

HACKING ON THE GHOST BLOGGING ENGINE WITH NODE.JS FOR VISUAL STUDIO

Let’s look at an example.

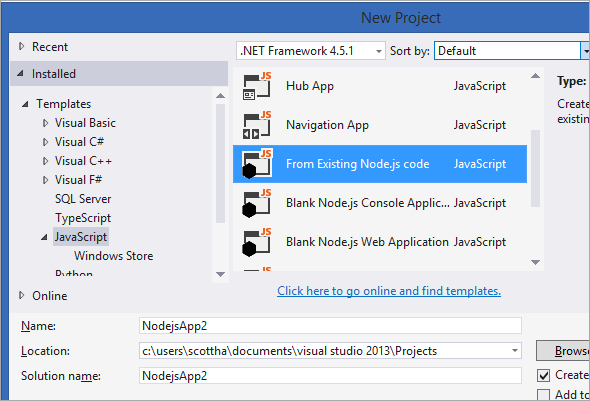
From within Visual Studio, go File New Project, click JavaScript, then “From Existing Node.js code.”

From Existing node.js Code

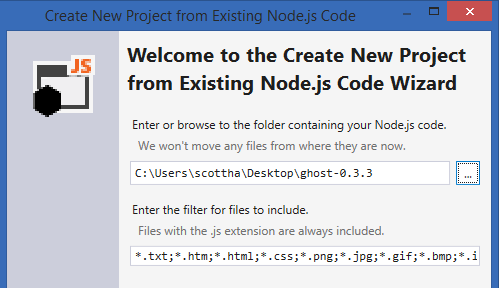
Point NTVS to your Ghost folder.

Create from Existing Code

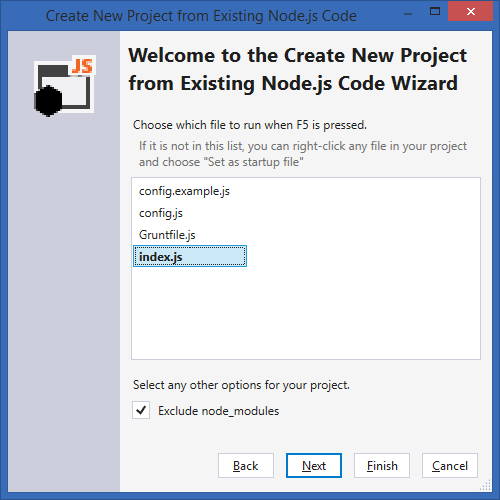
Then tell node.js for VS that the startup file is index.js, hit Next, save the project file and Finish.

Create New Project from Existing Code

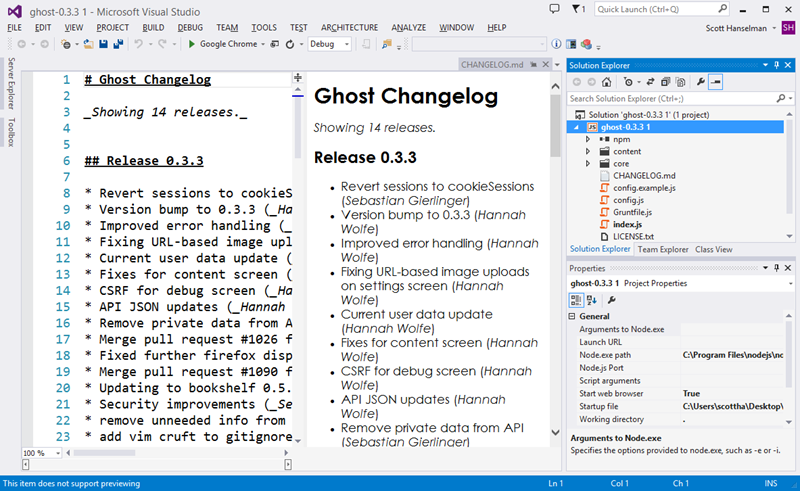
At this point, you’ve got Ghost inside VS.

Random: that since I have Web Essentials I also get a nice split-screen markdown editor as well.

From here, just hit F5 to Debug, or Ctrl-F5 to start without Debugging. Also notice the properties of the Project in the lower right corner there showing the node path and port as well as the Startup File. You can change these, of course.

Ghost inside Visual Studio with NTVS

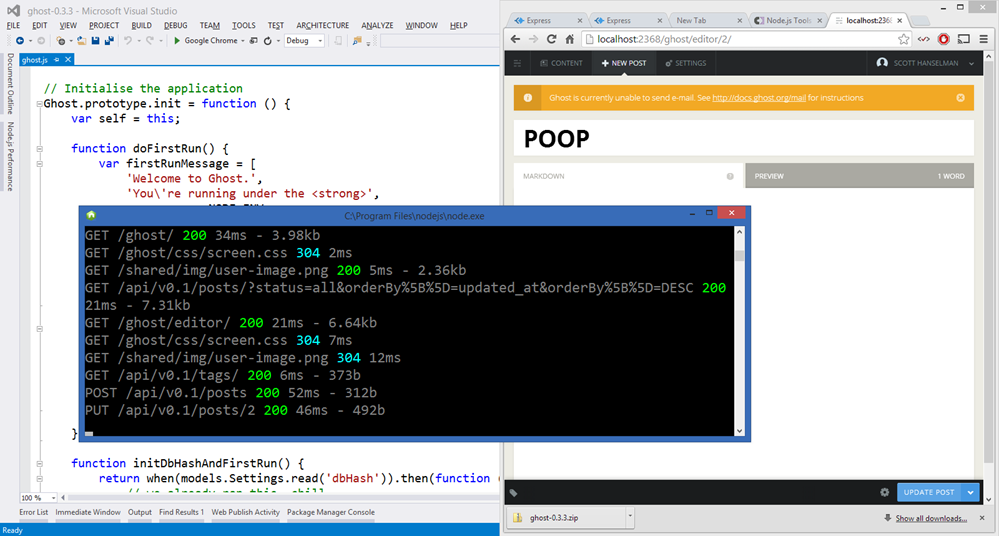
Here’s me running Ghost locally. You can see the path to node, the ghost.js file and my browser.

Running Ghost in VS with node for VS

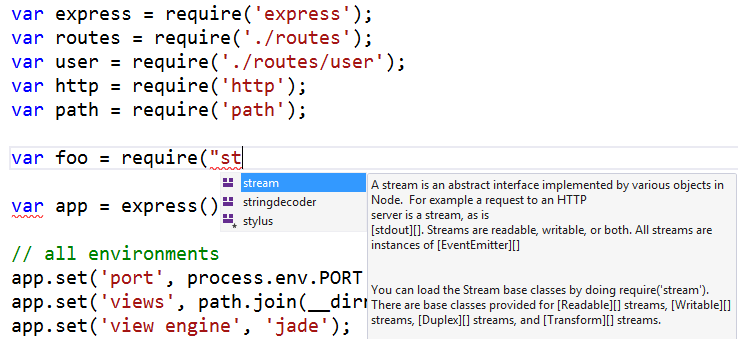
You’ll get good intellisense for completions and help for method signatures.

Intellisense example

DEBUGGING

Node.js Tools for Visual Studio includes complete support for debugging node apps. This includes support for Stepping, Breakpoints, “Break on exception”, as well as Locals, Watch, Immediate and Call Stack tool windows.

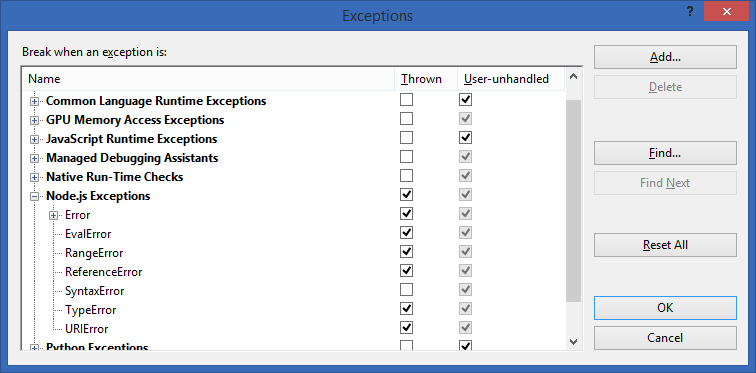
You can manage Exceptions just like any other language service. See in the dialog below node.js exceptions are listed along with other exceptions in managed and unmanaged code.

Managing Exceptions in node.js for Visual Studio

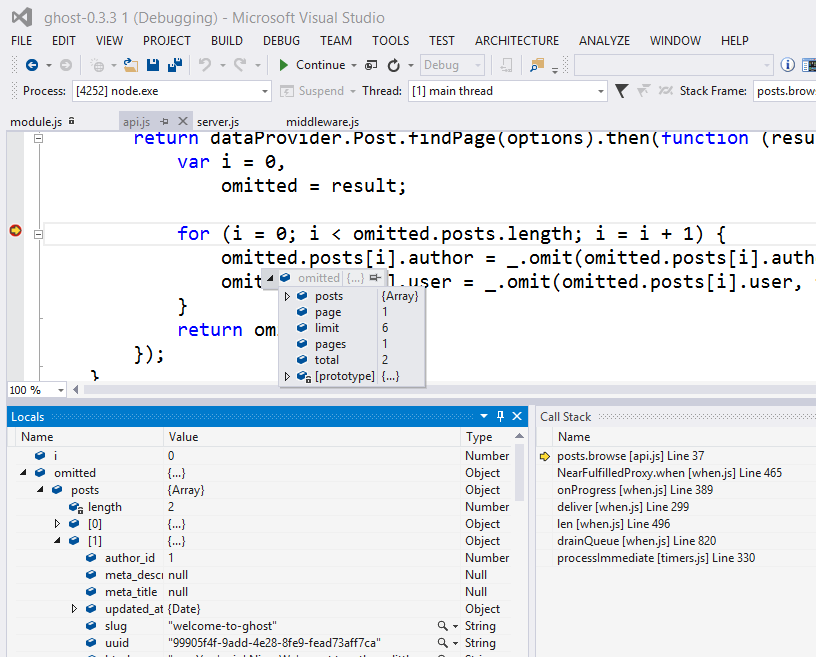
The debugging still happens like it always has, with the node V8 debugger, except Visual Studio connects to the debugger over another socket (remember, you can even debug node.js remotely running on a Linux or Mac like this!) and translates how V8 thinks into how Visual Studio thinks about debugging. The experience is seamless.

See in this screenshot, you can see node.exe is being debugged, I’m running Ghost. You can see my Call Stack, and the Locals in the Watch Window. I can inspect variables, step around and do everything you’d want to do when debugging a Web App.

Debugging Session of Ghost in VS with Node Tools for Visual Studio

NPMVISUAL STUDIO

The npm experience is pretty cool as well. Node.js for Visual Studio is always watching the file system so are more than welcome to run npm from the command line or from within the node immediate window and Visual Studio will see the changes.

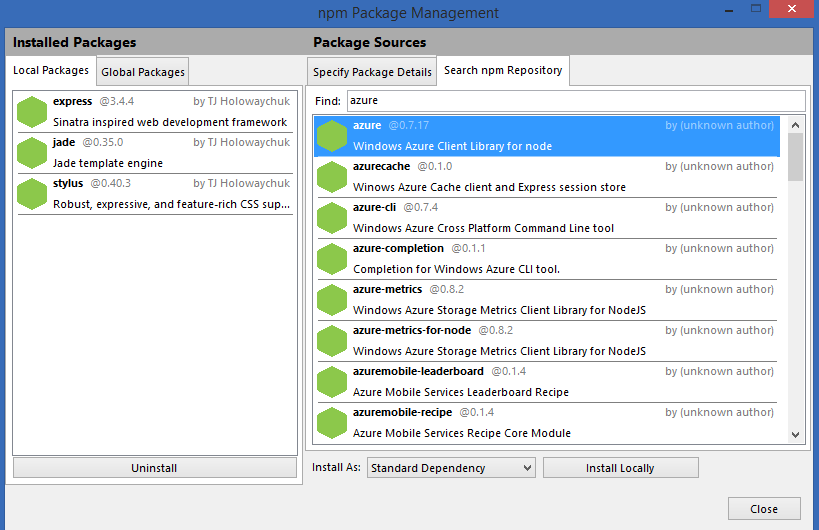
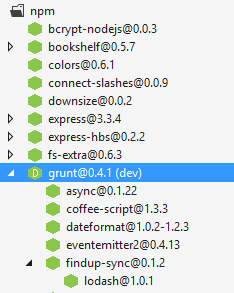
You can also use the npm Package Management dialog and search the repository and install packages graphically. It’s up to you.

npm package management within VS

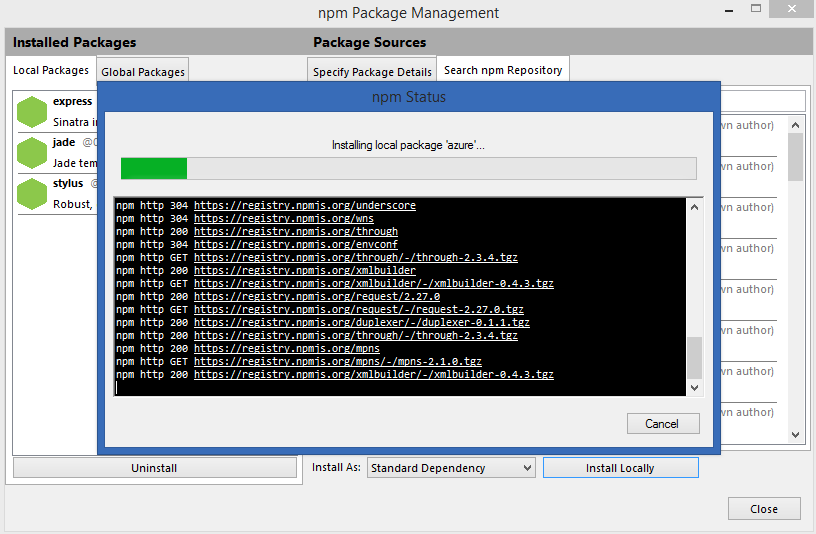
Here’s a package installing…

Installing a module

The physical node_modules and how modules are handled is pure node…VS doesn’t touch it or care. However, the Solution Explorer in Visual Studio also presents a logical view on top of the physical view.

image

NOTE: really like this. I think it has potential and I’d even like to see references in .NET treated like this. The physical and the logical, along with a dependency tree showing NuGet packages. It helped me understand the project much better.

There’s lots more. There’s an REPL interactive window, and you can just publish like any other web project using the same Publish Wizard that ASP.NET projects use. You can publish node.js apps directly to Azure as well, either with Git or with Visual Studio publishing.

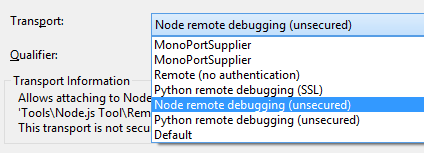
You can also remotely debug node instances running on other machines by starting node with the included Remote Debugging Proxy.

image

node.exe RemoteDebug.js -machineport 5860 script.js

As mentioned, you can do remote debugging between Visual Studio and node running on any server OS.

CONCLUSION

I’m personally pretty happy with the way that Visual Studio is turning (in a short amount of time, seems to me) into quite the competent language and environment factory.

Node.js Tools for Visual Studio is entirely open source under the Apache license and they welcome contributions and bug reports. It’s Alpha and it’s early but it’s awesome. Go get it. Big congrats to all involved!

via: http://www.hanselman.com/blog/introducingnodejstoolsforvisualstudio.aspx

Automatically Check And Remove Duplicate Bookmarks and Bad Links In Chrome

Do you have a lot of bookmarks saved in your Google Chrome Web browser? If you’ve been saving and constantly adding new bookmarks for months or even years, it’s inevitable that you’re going to have some links that are no longer valid.

You’ll probably also have a few duplicates here and there, since there’s no way that you can possibly remember every single bookmark you have. Meaning, you may often bookmark the same link.

Managing a large amonut of bookmarks is hard work, especially if you try to do it manually. One of the easiest ways to manage your bookmarks and automatically check for duplicates and bad links, is with the Chrome extension Bookmark Sentry.

Here’s how it works.

1. Install the Bookmark Sentry extension from the Chrome Web Store.

2. As soon as it’s installed, the extension will automatically scan all of your bookmarks. Within seconds, you should see your scan results automatically open in a new tab; this process may take longer if you have a very large amount of bookmarks.

Bookmark Sentry Scan Results

3. You should see all of your bookmark “problems” listed on the results page. You can manually check each problem (click on the link in the Bookmark column), and delete the bookmarks that are no longer valid (click on the X in the Delete column).

4. You are also free to do a manual scan at any time from the Bookmark Sentry Dashboard, located on its Options page (wrench -> Tools -> Extensions -> click on Options under Bookmark Sentry). Click on the “Scan Now” button when you’re ready.

When the scan is done, the Bookmark Sentry Scan Results page will open up in a new tab, just as it did when you first installed the extensions.

Bookmark Sentry Dashboard

5. From the Bookmark Sentry Dashboard, you can also schedule automatic daily, weekly, or monthly scans. Choose your preferred interval from the “schedule scan” menu; a monthly scan is already enabled by default. You can choose to check for just bad links, just duplicates, or both bad links and duplicates.

With Bookmark Sentry, you no longer have to worry about duplicate bookmarks or bad links; it does all of the work for you.

via: http://www.maketecheasier.com/remove-duplicate-bookmarks-and-bad-links-in-chrome/